How to Make SaaS Pricing Decisions That Maximize Growth Financially
SaaS Pricing Is a Financial Decision
SaaS pricing decisions are financial decisions. You have to pick the optimized price to scale your business fast. You can’t decide without seeing financial data, because pricing is deeply related to your cost structure and cash timing.
First, you get pricing data by conducting a pricing test. You get something like this:
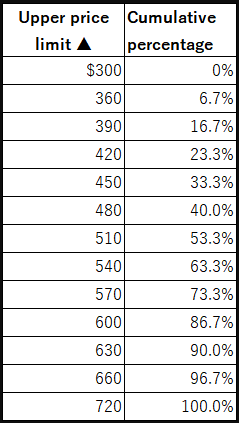
The Price and Cumulative Percentage Table
How to Interpret Pricing Test Result Data
Pricing test results show in percentiles. For example, 23.3% of people say they can pay up to $420; more than that is expensive and they might stop buying it. In other words, 76.7% of people would still buy it. At $720, 100% of people think it’s expensive, so 0% would buy it.
Your SaaS growth is decided by the compounding effect, but which price compounds your SaaS growth the most?
Compound growth is decided by only 2 things: 1. the ROI and 2. how fast you can collect CAC for reinvestment.
ROI: Why LTV Is a Useless Metric
ROI is calculated by LTGV (Lifetime Gross Value) / CAC. LTGV is LTV (Lifetime Value) minus variable costs per customer.
Variable costs are the costs that increase as your sales volume increases. For example, if a customer buys Coke for $1, and the ingredients, materials, and shipping fee per Coke is $0.60, your additional profit is $0.40, not $1. So suppose they buy Coke every day for a month and stop buying it—The LTV is $1 × 30 = $30.
It’s a ridiculous example, but it illustrates an important point. If your CAC is $20, that seems profitable since it’s less than the LTV of $30. However, your total costs are variable costs of $0.60 × 30 + CAC of $20 = $38, which actually exceed LTV. You need to use LTGV instead because it shows your true additional profit after accounting for variable costs. In this case, LTGV is $0.40 × 30 = $12. So if CAC exceeds $12, you’re making a loss by selling more. This is why LTGV vs. CAC comparison is the key.
To calculate LTGV, you need to calculate variable costs. Variable costs in a SaaS business include things like average API usage costs per customer, transaction fees on Stripe, and average cloud computing storage usage costs per customer.
Suppose your total variable costs are $120/customer here.
Variable costs usually don’t increase even when your price increases, so when you hike the price by 20%, the additional profit increases a lot more than that. For example, if your variable cost is $120 and your price is currently $300, the additional profit per customer is $180. Even when you hike the price by 20%, the variable costs stay the same. So, the new price is $360, and variable costs are $120. The additional profit is $240—the profit increases by 33% not 20%.
That is why, even if you lose sales volume from a price hike, the profit from the hiked price can exceed that loss, making the price hike a better option.
Choose pricing that provides better ROI and enables faster growth.
The Most Important Metric to Grow Your SaaS: CAC Collection Period
But ROI alone is not enough. If it takes 10 years to collect CAC, even if LTGV is high, it doesn’t matter. So you have to confirm how long it takes to collect CAC.
In modern SaaS, yearly payment brings the most cash flow. Monthly payment brings steady revenue, but that doesn’t compound your business fast. Yearly payment is earned in the customer’s first month (or it might take more than 3 months to get the first payment if you’re dealing with enterprises). So the first month’s cash collection decides the majority of cash inflow available to reinvest.
Suppose, 70% of your customers choose yearly and 30% choose monthly payment. And the average fee per month for yearly payment is $300, and monthly payment is $360. The first month’s cash inflow is 70% × $300 × 12 + 30% × $360 = $2,628. After that, you collect $108 from the monthly subscribers. Compared to the first month’s cash inflow, the monthly fee payments have very low impact on compounding growth.
At $300, the first month cash inflow/CAC ratio is 87.6% ($2,628/$3,000), so you can reinvest 87.6% of the original CAC immediately. This compounds your growth fast.
How Price Changes Your CAC
Your new price also determines your new CAC. See the table below. Suppose your original price is $300 and CAC is $3,000, when you hike the price, the CAC changes like this:
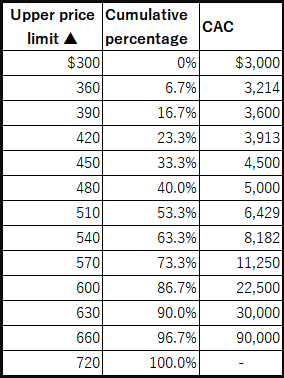
Assume your conversion rate is 1% at the original $300 price point. At $300, 100% of the 1% of people (that is, 1% of all potential customers) will buy. When you increase your price to $480, 40% say it’s too expensive, which means only 60% of the originally buying customers will buy. So 60% of 1% would buy—that’s 0.6%. Now your conversion rate is 0.6%, and the new CAC becomes $5,000 ($3,000/60%).
If you used to send emails to 100 people to get 1 customer, now you need to send to 1/0.6% = 166.66… people. The cost increases by 66%.
Picking the Best Price
Now you have learned the 2 things that decide your growth: ROI and first month cash income/CAC ratio. Then you put all the things together to make a table.
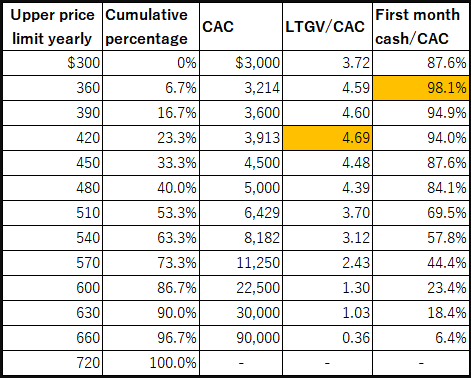
At $360, the first month cash inflow/CAC ratio becomes the highest, it is close to 100%. At $420, the LTGV/CAC ratio (ROI) becomes 4.69, the highest. But in many cases, the first month cash inflow/CAC ratio beats ROI in growth rate.
Simulating Growth With Real Numbers
To confirm which price actually grows your SaaS the most, you can make a cash flow simulation of your business using different pricing. First, you pick the prices with the highest first month cash inflow/CAC ratio and ROI. Then you test only those chosen prices, because making a simulation for every pricing point takes time. You can download a SaaS financial template from here.
Or you can check which pricing compounds the most by making a simple simulation in Excel.
For example, let’s say you spend $30,000 on CAC when your average product price is $300. In the next month, you collect 87.6% of that back ($26,280) from first month payments. You can immediately reinvest that $26,280, which generates another 87.6% back, plus you keep receiving monthly payments. By tracking this compounding effect month by month, you can see which price generates the most total cash inflow from that initial $30,000 investment.
In this example, at $360 pricing, the total cash inflow over 3 years is $6.8M from that initial $30,000 investment. At $420, the total cash inflow is $5.8M. So $360 is the optimal price that maximizes your business growth.
You can download this “Hyper Growth Price Picker” here to run your own simulations (link).