Secrets of the Astonishing Cash God: Pinduoduo’s Remarkable Journey
PDD (Pingduoduo) is a genius cash-creating monster. Even when it made a loss of 1 billion in 2020, it generated a 4.5 billion positive operating cash flow. After that, it started making profits, creating even more cash flow.
PDD operates an online shopping platform called Pingduoduo app in China and Temu app in the US and other countries.
If you’ve never used one, please access the Temu site from your PC. You’ll experience its addictive shopping experience. You’ll immediately understand what it’s like. On Temu, you can buy various things made in China at very cheap prices delivered directly from China.
It seems like PDD is selling those products, but it’s not. PDD is just a platform operator; manufacturers and merchants in China are actually selling products directly to clients on the platform. PDD is just connecting customers and manufacturers. They put their product on the Temu site, and people keep scrolling the site. When they’re interested, they click on the product. That’s when PDD gets the fee. PDD gets the fee from merchants by clients’ clicks, not by selling products.
Followings are PDD’s cash generation methods:
1. A high net profit rate certainly contributes to higher cash flow.
2. Very low asset model. Normally when sales increase, you have to increase assets too, so you have to put more cash into operations or fixed assets. When sales increase, cash decreases, even if net profit increases.
For example, if your sales are $100, and profit is $7, and your assets are $300, when you increase sales to $200, you need another $300 in assets to generate that sales. This means you get $14 profit, but you have to put $300 in assets, so the cash flow is -$286. This is an exaggerated situation, but similar things happen when sales increase.
3. Negative CCC (cash conversion cycle). CCC measures the time period between when a company pays for its inventory and when it receives payment from customers. This metric is critically important because a shorter CCC means your business needs less operating cash, allowing your company to become cash-rich. For more detailed information about CCC, please read my CCC article. For normal companies, the CCC can vary, but let’s say it’s around 4.5 months, which means it takes 4.5 months to convert your shop items to cash. For PDD, it’s negative, -3.6 months. This means they virtually get cash 3.6 months before you purchase your items. I will explain this later.
1. High net profit rate
When you see the P&L (Profit and Loss statement) of PDD, the gross profit rate ((sales-cost of revenue)/sales) often exceeds 80%. This is very high compared to other e-commerce companies like JD, which had only 15% in 2023.
This is because product purchasing costs are not included in the cost of revenue of PDD. As I said, PDD just lets manufacturers use the platform, not buying and selling the product like JD or Amazon (except for Marketplace). So, the cost of revenue mainly consists of the site or app maintenance cost. Letting others sell on your platform is a very lucrative business.
The rate is much higher than that of a similar platform operator, Alibaba (just getting commission from merchants, not selling things on their own). Alibaba’s gross profit rate was only 37% in 2023. The rate was much better in 2016 at 66% but has significantly decreased these days.
Alibaba spreads its resources to many businesses, and those businesses are not profitable at all. On the other hand, PDD is focusing on the most profitable e-commerce business, which leads to that high gross profit margin.
As you learned, more clicks are better for PDD, since they get the fee by click. The best way to make people stay longer (thus get more clicks) is to increase the number of products on the platform. When you scroll the site or app and new items keep showing up randomly, your brain releases dopamine, you get addicted, and stay longer.
Providing huge benefits to sellers is the key to platform success.
The number of manufacturers and merchants on PDD increased from 5.1 million in 2019 to 14.2 million in 2023. That’s a lot.
(From annual reports)”

This increase is because PDD is giving huge advantages to manufacturers. On Temu, Chinese manufacturers can:
1. Sell directly to their clients without brokers
2. Sell to people living in higher-income countries (setting the price higher)
3. Ship those products directly to clients avoiding tariffs (shipping items priced less than $800 directly to individuals incurs no tariff in 2023, at least)
4. Get exposed easily due to the platform’s popularity
So, merchants can get good deals on Temu even if they are selling products very cheap.
When you look at the company’s profit and loss statement, S&M (sales and marketing) costs were 71% of sales in 2020. This is a necessary cost to attract new users. If they reduce the cost, they might lose clients. But what if they could magically reduce the S&M rate significantly without losing sales? The company could become much more profitable.
Their addictive shopping experience is solving this problem. In 2023, the S&M rate became 33%. Sales were $35 billion, S&M $12 billion. This is a significant rate reduction from 2020’s 71%. Usually, when sales increase, S&M costs increase at the same time. This is why many rapidly growing companies never become profitable.
How did they do this? Actually, the number of users didn’t increase much. At the end of 2020, they had 720 million users, and in 2023 Q3 there were 810 million (estimated) users. Compared to the significant increase in 2019 (429 million to 720 million), this is not a huge increase at all.
The only thing the company increased was the clicks. As we saw it, PDD accomplished it by giving huge advantages to manufacturers, it increased the number of manufacturers and got more products on the site making the site and app more addictive.
Then they got more clicks from almost the same amount of active users. That is how it can reduce S&M (sales and marketing fee) rate at the same time increase revenue. They didn’t have to acquire new clients by spending a lot on advertising.
You can see this in 2021 1Q active users are 724 million and revenue was $3,383 million, that means, each user generates around $5 in 3 months 90 days. 5 cents each day. Suppose 1 click average costs 5 cents for manufacturers. Users use the app once in 3 days and click 3 times on average, it is achievable.
In 2023 3Q, active users were 810 million (estimated) and revenue was $9,435 million which means each user generates around $12($9435M/810M) in 3 months, 13 cents a day. Suppose the 1-click average cost doesn’t change, users use the app once in 3 days but click 7 times(13cent/5cent*3days) on average, close to twice more clicks.
Like these, you can imagine how business works with company figures.
You can decrease S&M (sales and marketing fee) too. By selling more things to existing customers, you can reduce S&M rate. Provide more solutions or better premium solutions to customer problems.
2.very low asset model
PDD basically maintains the same platform (Temu app was released later, but it is very similar to Pingduoduo), only merchants and clicks increased, so the amount of assets didn’t change much.
Only sales and net profit increased. You can actually see this in its ROA. ROA is the return on assets, calculated by net profit/assets, which shows how efficiently the company invested in assets in the past. If the ROA is high, it means the company invested wisely in only profitable businesses.
It indicates the managers’ past investments were great, and if the industry or competition situations don’t change radically, the company will likely keep making good investments in the future. In 2023, PDD’s ROA was 17.2%. For Alibaba, it was 6.1%. When the ROA drops, you can see the company is losing its edge.
Also, high ROA means it uses fewer assets to earn profit; the company has a low asset model. When it scales, it needs very few additional assets, making it easy to scale without cash shortages or stock dilution.
PDD is cash-rich, so it just accumulates cash and doesn’t use it in operations (CCC is negative). So when you put cash aside from assets, you can see the real ROA of PDD, and it was 87%. Insane. And of all 49 billion assets, 39 billion (80%) of all assets consist of cash, which is insane again.
Unlike Alibaba, PDD maintained its focus on the core e-commerce business, avoiding the acquisition of unnecessary assets from failed M&A.
Focus is golden diversification is a way to decline.
3. Negative CCC (cash conversion cycle)
CCC shows how good the company is at getting cash from daily operations. If CCC is low, it’s good because the company can get money from operations early.
Breaking down CCC: CCC = DIO + DSO – DPO. DIO is inventory shelf period, DSO is receivable collection period, and DPO is payable payment period. For PDD, DIO is 0 because it has no inventory, and DSO is close to 0 because receivables are almost nothing, as Temu users have to pay when they order on Temu. And DPO is very long, 3.6 months. Hence, the CCC is -3.6 months.
This means PDD retains the cash that customers pay at the time of purchase for a period of time. Only after a certain amount of time does PDD finally pay the manufacturer, and even then, it’s the purchase price minus PDD’s fee. While PDD will eventually pay this amount, they continuously receive new transactions before each payment is due. As a result, PDD can perpetually maintain a cash reserve equivalent to 3.6 months of transactions.
However, 3.6 months is too long. In reality, PDD pays much earlier. PDD only accounts for its fee as sales. Suppose PDD’s fee is around 10% of the sales price, and the sales price is 100. PDD receives 100 first, then keeps a fee of 10, which becomes PDD’s sales. So the DPO of 3.6 months actually means the payable is paid after 0.36 months (if the fee is 10% of the full price), or 10.8 days after the transaction.
10.8 days is not particularly long, but holding the cash for these 10.8 days provides a significantly positive effect on its operating cash flow.
When CCC is negative, the growth in sales leads to an increase in cash from operations. That’s why this company is so cash-rich. PDD receives the full price but doesn’t have to pay for inventory purchases because it’s just letting merchants use its platform. This gap generates tremendous cash.
If PDD wants to increase its cash, it can easily do so by extending the DPO. There’s proof of this: in 2019, the DPO was insanely long at 22 months. If PDD’s fee is around 10%, this means PDD pays 2.2 months after the product is sold.
As I mentioned, the platform offers huge advantages to merchants. They are willing to wait for 2.2 months to get paid.
Moreover, strong cash flow from operations, very little debt, and piled-up cash provide huge trust in PDD. Trust is very important for longer payment periods. Merchants don’t worry about anything, even with payments coming 2.2 months later
For those who want to know how CCC actually affects cash:
Suppose you can sell a product for twice the price you bought it for. For example, in year 1, you buy inventory for 100 and sell it for 200, but you don’t pay the payable of 100. In this case CCC consists of DPO: -100(payable) / 200(sales) * 12 months = -6 months. The profit is sales 200 – cost of sales 100 = 100. Cash flow from CCC is sales increase of 200 (from 0 to 200) * 6 (CCC) / 12 = 100. So total cash flow is profit + cash flow from CCC = 100 + 100 = 200.
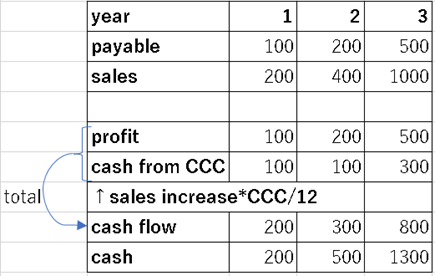
You can calculate the second and third year in the same way. For example, in the second year, you pay the payable from last year -100, you sell things for +400, and you get a new (200) payable but don’t pay it yet, so there’s a ±0 cash flow from payables. So the total cash flow is +300. You can also magically calculate this as the total of profit 200 and cash from CCC 100 (sales increase of 200*6/12) = +300.
Anyway, you now see how negative CCC and profit contribute to cash flow. Increasing both of them improves your cash position.
If CCC is positive, the opposite happens and sales increases reduce your cash. So make sure to keep your CCC low; even negative is the best.
PDD has invested the cash from operations heavily in S&M (sales and marketing) in the past, spending an amount equal to 71% of its revenue in 2020. And that investment has turned out very well. Sales increased significantly in the past (125 times higher sales in 6 years). But now the relative amount of S&M is decreasing, they have to come up with new ideas about how to use their piled-up cash to earn future cash flow.